Debate Continues Surrounding
Health Effects of Air Pollution
By Garrett Riha
Motivation
On September 8, 2018, hundreds of thousands people around the globe gathered together in demonstration, demanding more effective and immediate climate action from their public officials. The demonstration that took place in San Francisco, CA was notable, not only because of its size but also because of a unique nuance that arose. Many in San Francisco were not only demanding climate action; they were also critiquing California's market-based climate laws [1].
In Climate Change from the Streets (forthcoming, Fall 2019), Dr. Michael Mendez, of the Yale School of Forestry and Environmental Studies, reports on his time as a public policy advisor, senior legislative consultant, lobbyist, and gubernatorial appointee during the passage of California’s climate change laws. Through his book, Mendez argues, "that environmental protection and improving public health are inextricably linked and maintaining that link is key to advancing future climate action policies." Dr. Mendez's research motivated me to assist in the mission of reframing climate change issues to be both a concern for the viability of our environment as well as current public health and equity [2].

Saul Gonzalez / KCRW
On March 28, 2019, NPR's Rebecca Hersher reported on an Environmental Protection Agency hearing at which several members of the agency's powerful science panel expressed doubt regarding the "the long-established scientific consensus that air pollution can cause premature death." These statements raised a lot of attention not only because of the agency's important position of power, but also because of the immediate response by former members of the EPA's now-disbanded Particulate Matter Review Board. These former members critique that the statements come from "a very small community that have scientific credentials but are moving outside their area of expertise to try to raise doubt after doubt on issues where they really don't have the strongest competence" [3].
This news has inspired me to frame my final product to follow an informative narrative that encourages the audience to explore the relationship between air pollution and public health, enabling them to develop their opinions and grow in their interest towards the issue.
The Data
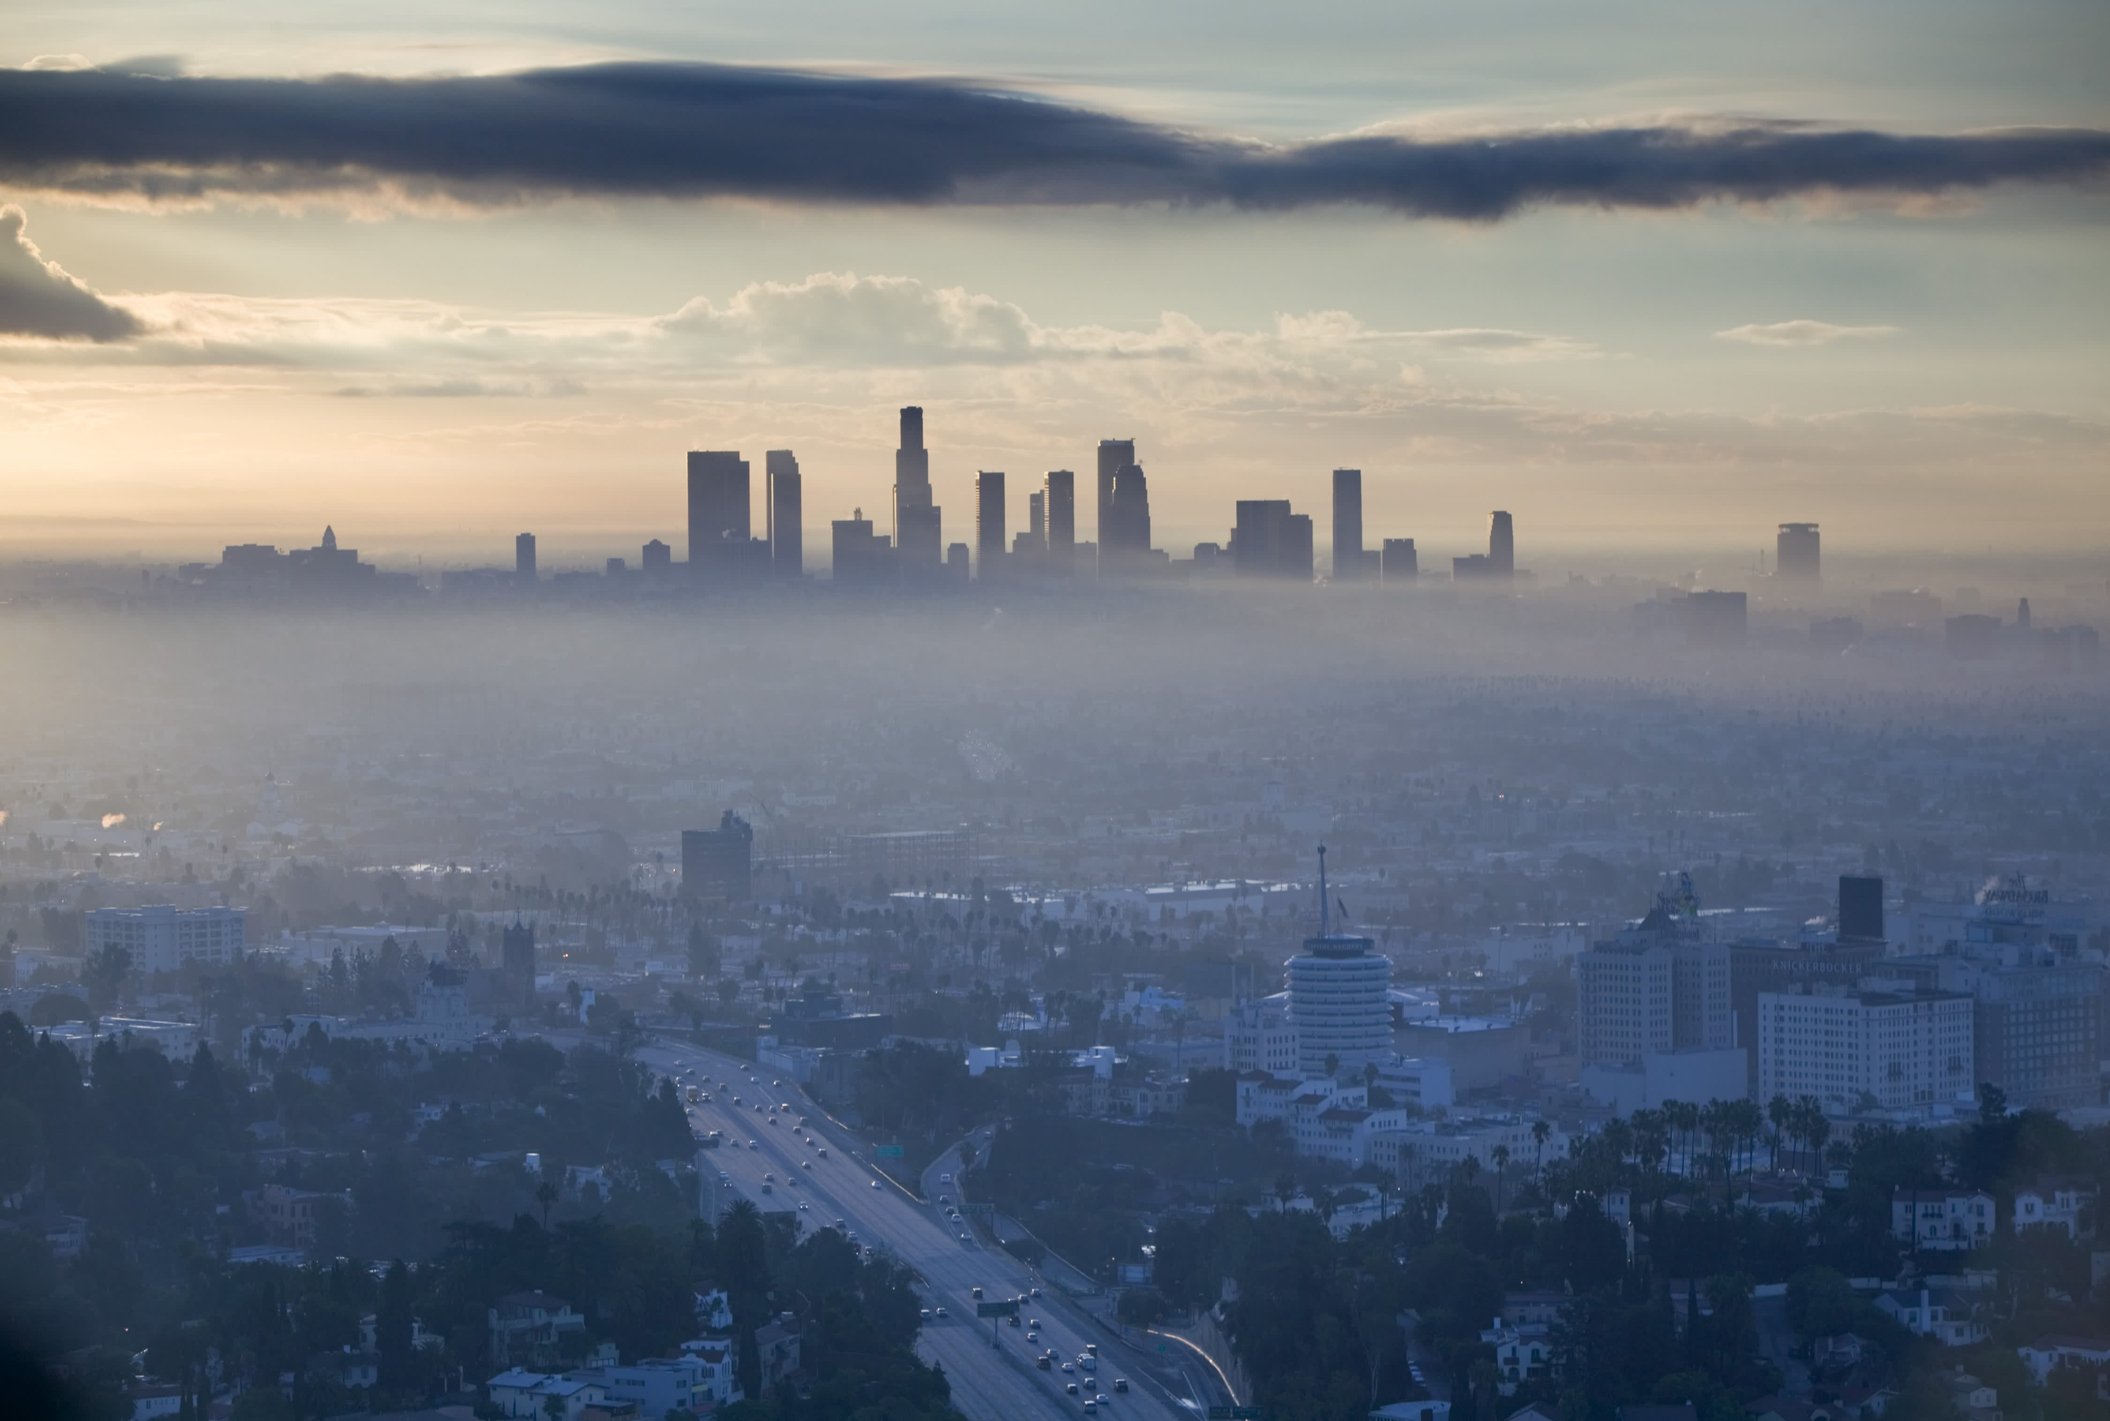
Barring the recent controversy, the established science on the issue has regarded air pollution to be seriously detrimental to public health. In addition to reporting that researchers have generally found that exposure to fine particulate matter (PM2.5) is associated with the development of asthma and cardiovascular disease, the EPA has also shared a recent study from researchers from the Children's Center at Stanford University, which suggests that "air pollutants suppress genes that regulate the immune system’s ability to differentiate an allergen from a dangerous foreign substance, such as a virus or bacteria" [4]. The World Health Organization, the United Nations's agency specializing in public health, reports that ambient air pollution accounts for 24% of all deaths from stroke, 25% of all deaths and disease from coronary heart disease, and 43% of all deaths and disease from chronic obstructive pulmonary disease [5].

F. Carter Smith / Getty Images
Clearly, however, the scientific community has not entirely reached an agreement regarding the degree to which air pollution impacts public health. While the debate continues various organizations have been collecting data on air pollution and various health qualities that are often claimed to be worsened by air pollution. With much of this data public we can evaluate the various relationships for ourselves. Below are 5 maps of Los Angeles, CA demonstrating the levels of air pollution, asthma rates, cardiovascular disease rates, deaths from coronary heart disease, and deaths from stroke, each represented at the zip code level as a percentile of all of California. It's important to note that air pollution is measured as the annual mean PM2.5 concentration, which refers to atmospheric particulate matter (PM) that have a diameter of less than 2.5 micrometers, which is about 3% the diameter of a human hair. Additionally the air pollution percentile map is displayed twice, as the first map and the last map, to allow direct comparison to each of the public health qualities.
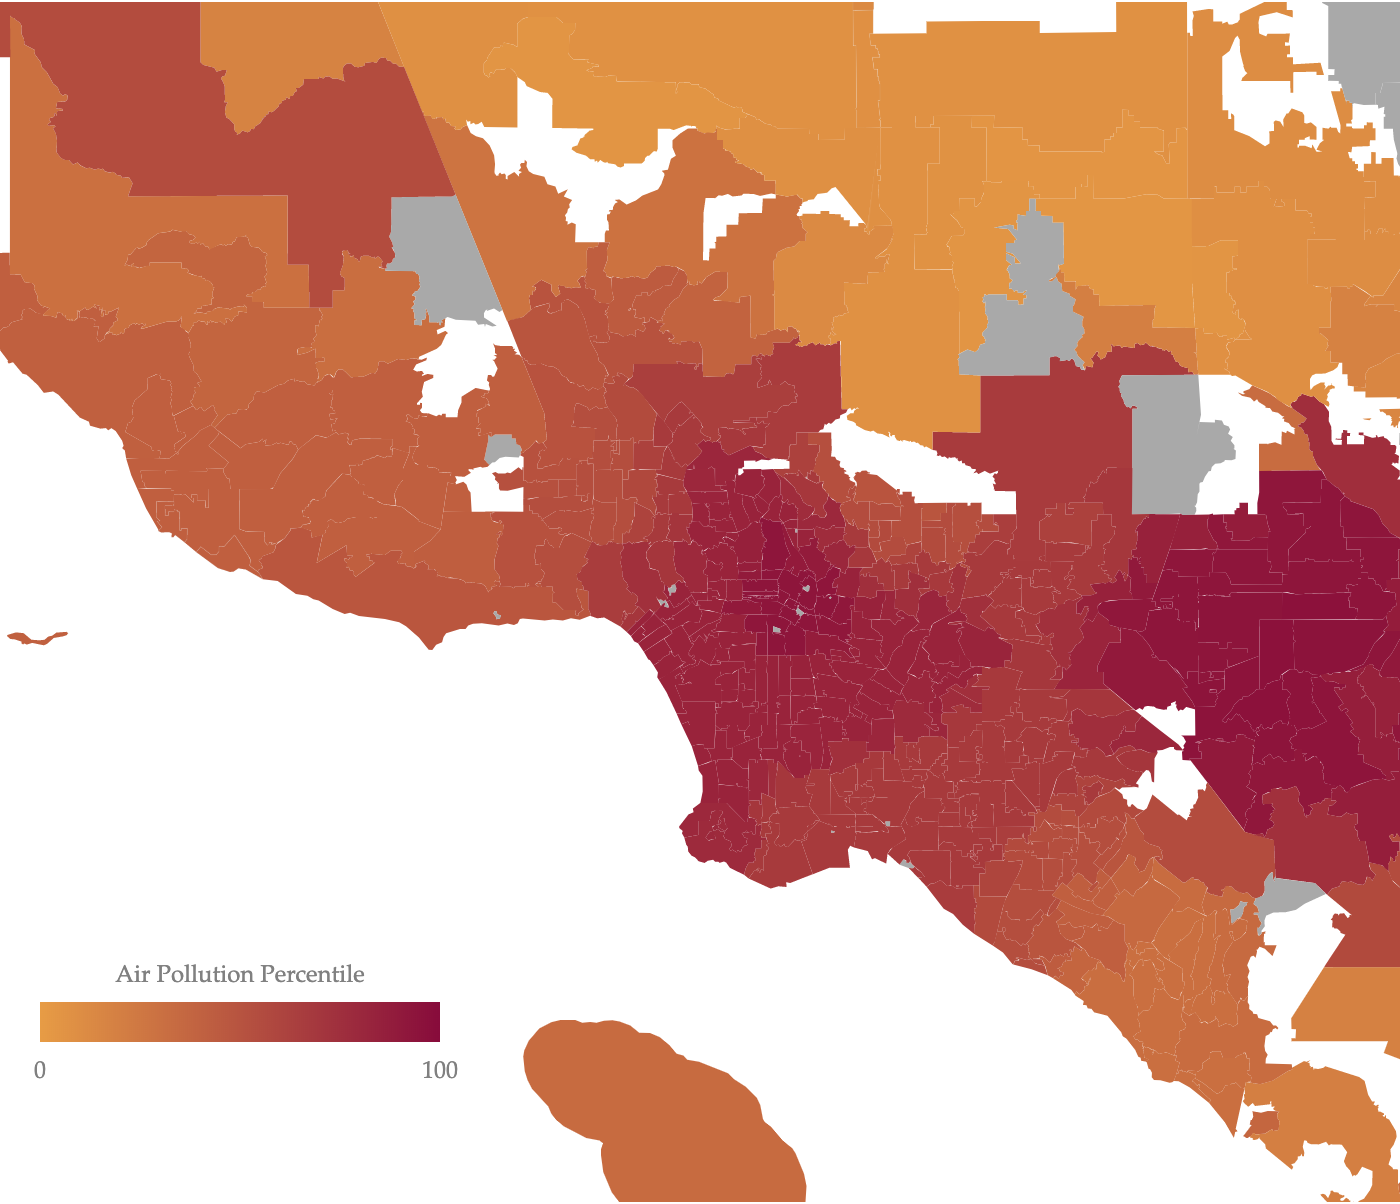
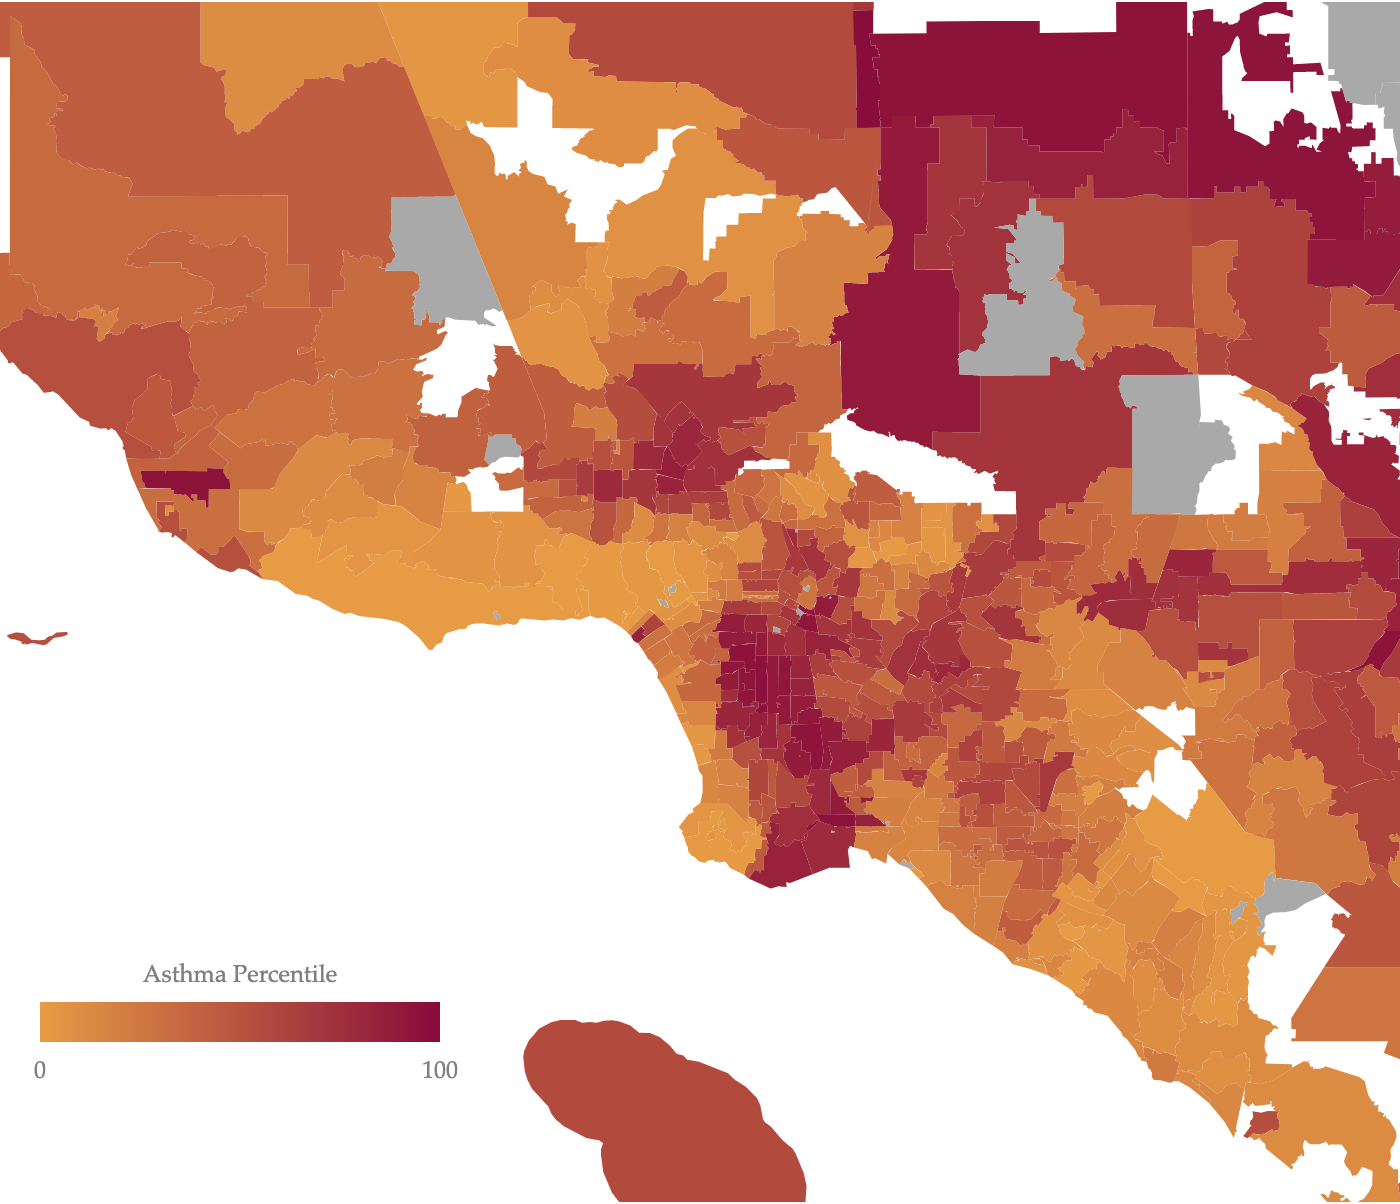
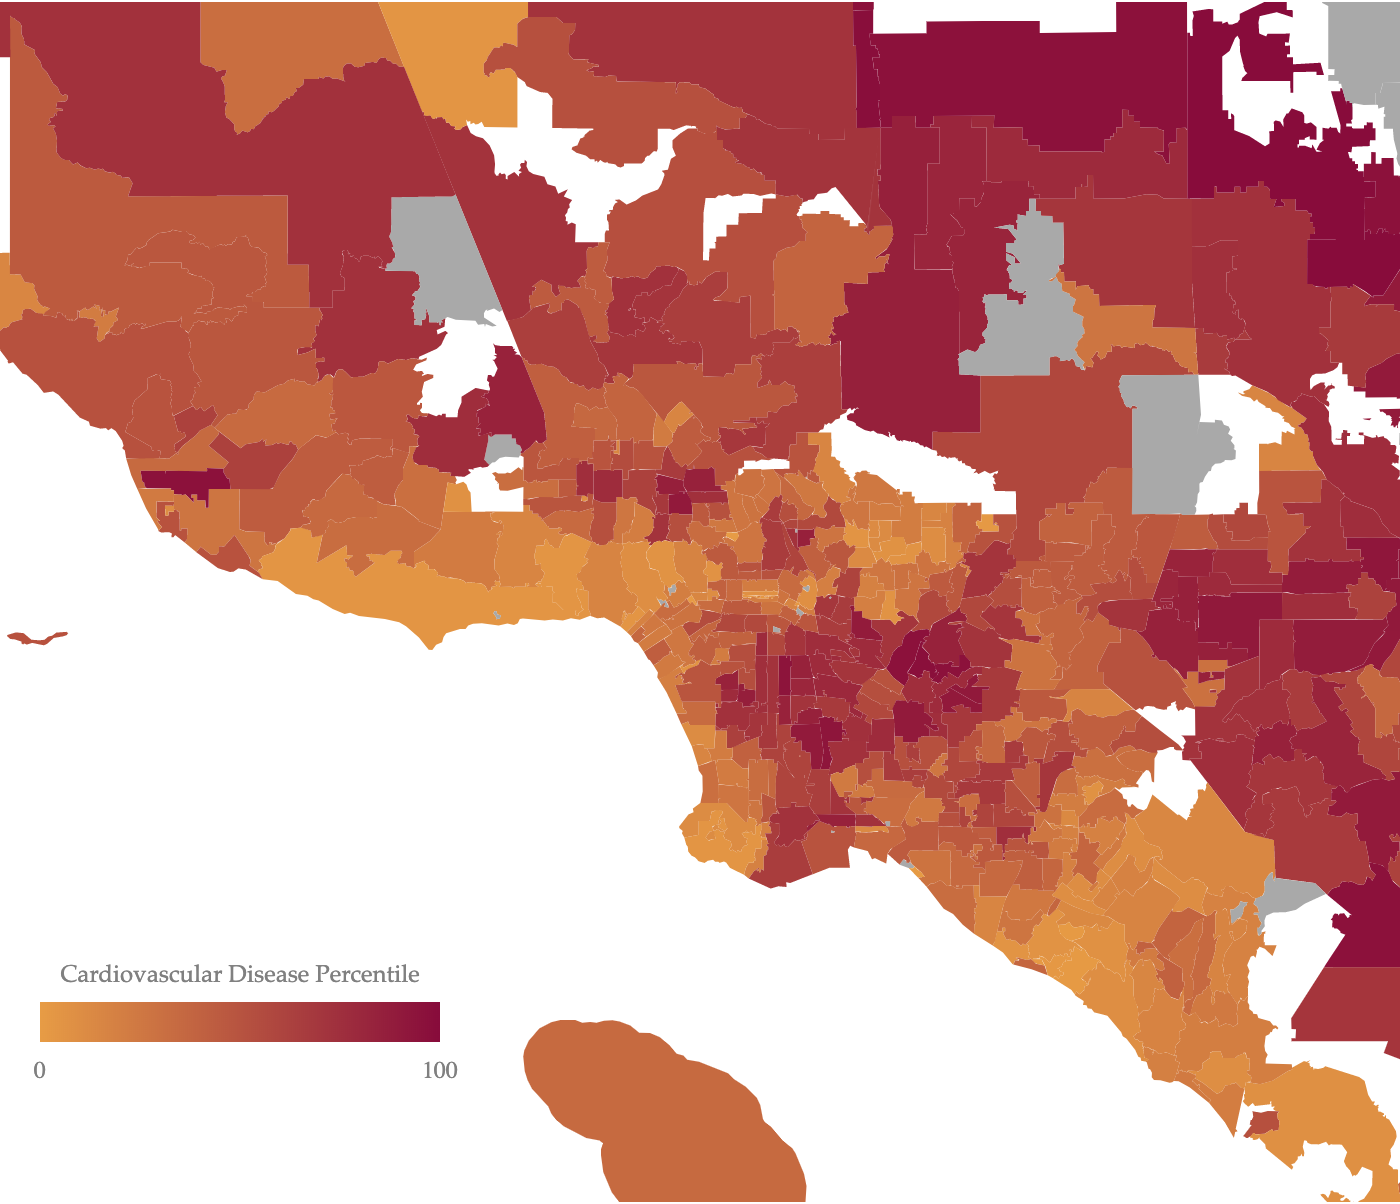
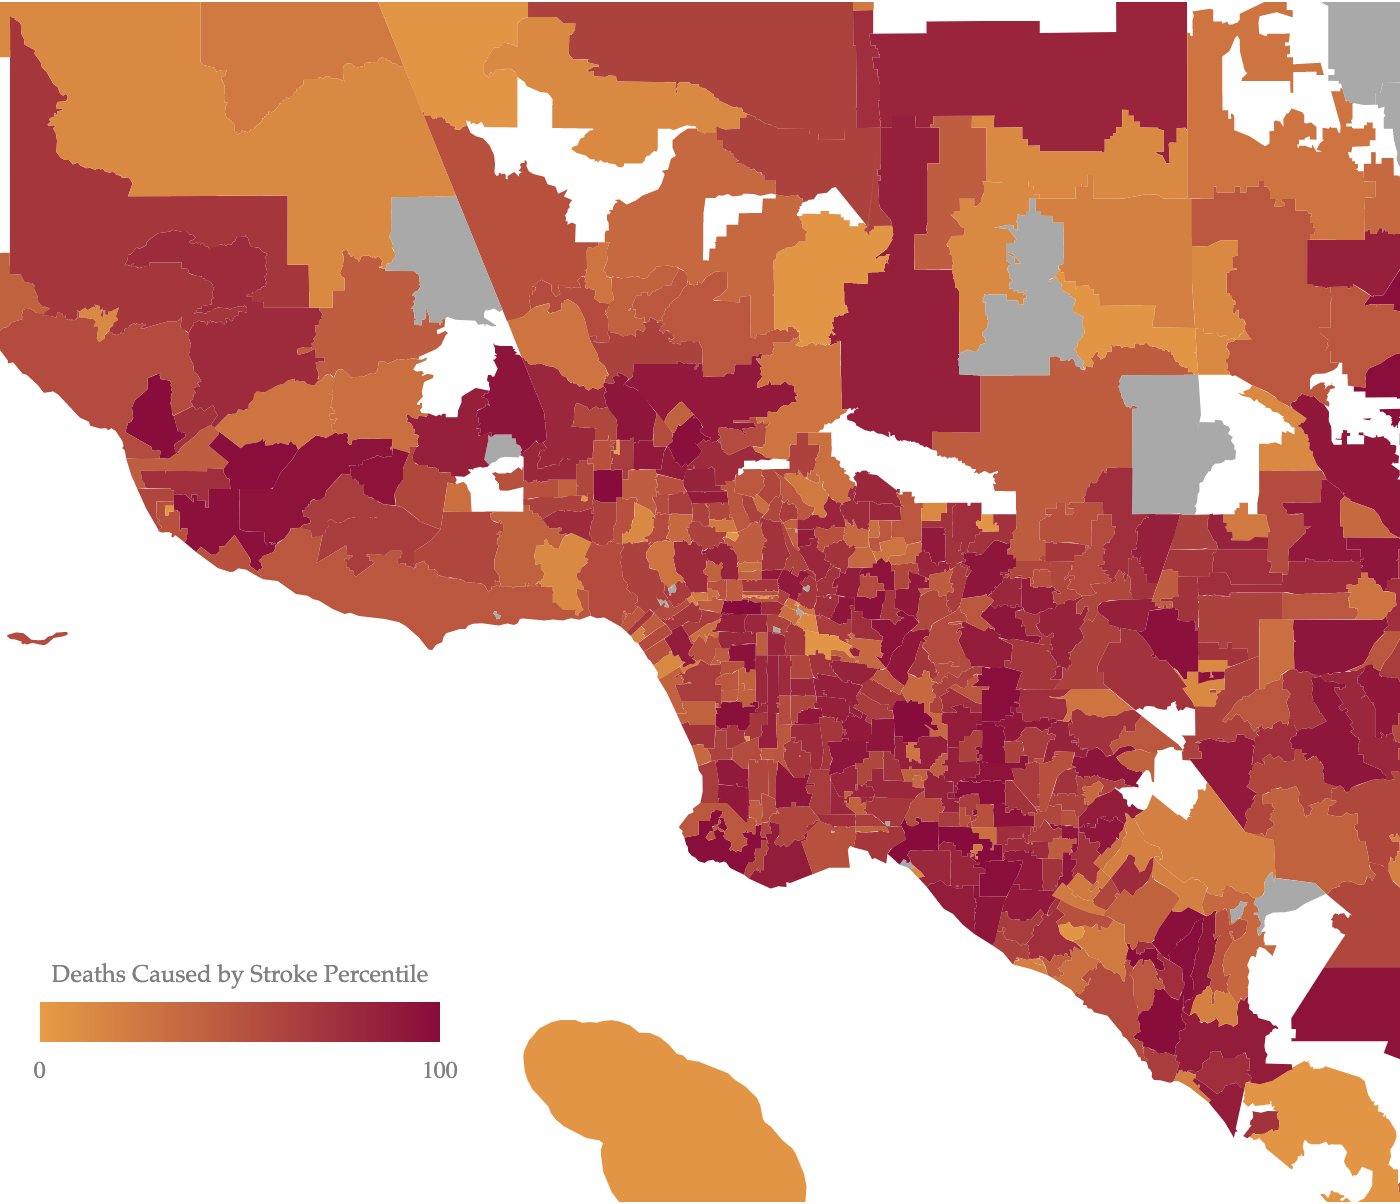
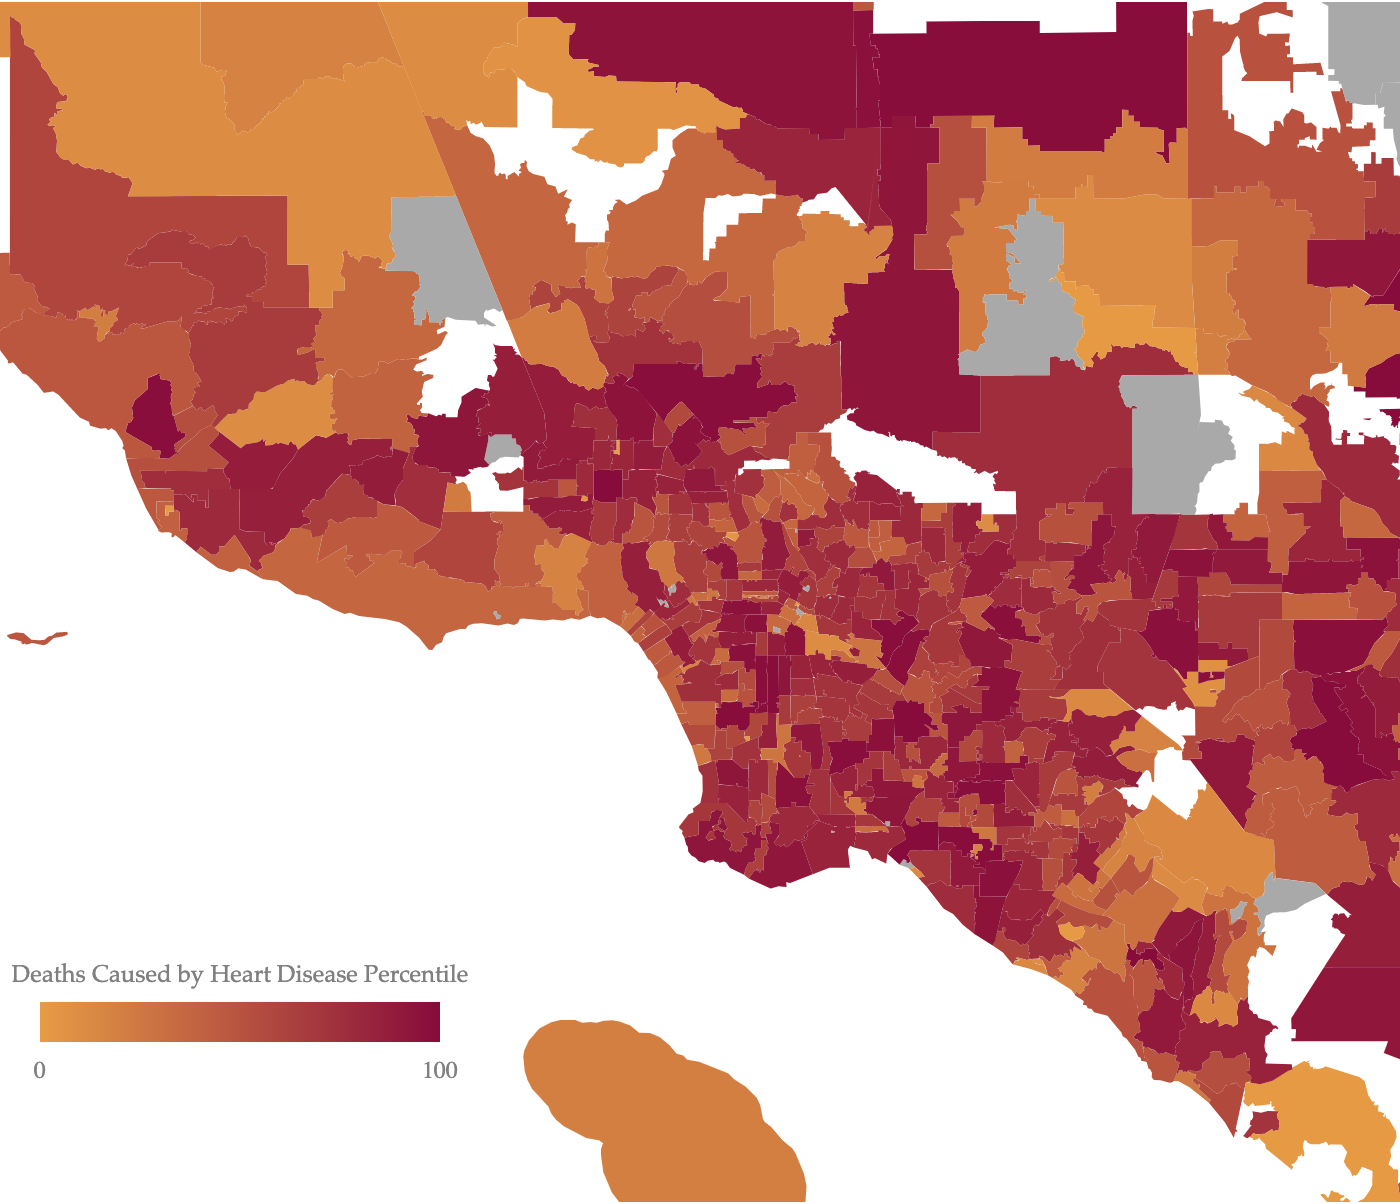

A correlation between air pollution and asthma and cardiovascular rates can be seen in these maps. However the asthma and cardiovascular rates are quite high in Antelope Valley (upper right portion of map), which experiences comparatively less air pollution than West Los Angeles (coastal portion of land that sits just north, rather than east, of the ocean). This phenomenon raises interest in the socioeconomic and cultural factors that lead to asthma and cardiovascular rates, with the major towns of Antelope Valley (Lancaster and Palmdale) resting in deep contrast to the socioeconomic and cultural norms of the major towns of West Los Angeles (Malibu and Calabasas). It should also be noted that there seems to be no relationship between air pollution and the rates of deaths caused by stroke and heart disease.
To explore these relationships further, check out the interactive maps below. Please note these maps provide for zooming (via scrolling), panning (via dragging), and a tooltip appears to the left of the map, describing the various zip code attributes, when the cursor hovers over a zip code.
Air Pollution
Asthma
Cardiovascular Disease
Deaths Caused by Stroke
Deaths Caused by Heart Disease
Reflection
While I believe these visualizations do a satisfactory job in meeting the aim to encourage the audience to consider the public health impacts of air pollution, I feel that it falls short of providing the audience a truly helpful resource that sufficiently answers the larger question of what relationship exists between air pollution and public health. I would like to include a scatter plot demonstrating this relationship, which I think will be more helpful in answering that larger question. I would also like to make some additions to the current visualizations. First, I would like to overlay county lines and build an interactivity that communicates the name of county of the zip code that the user is hovering over. Second, I would like to add a background map of California to fill in the shape of the state. Third, I would like to make some significant aesthetic changes to the information tooltip to make it feel like an important object that belongs on the page, rather than an auxiliary add-on. Finally, I'd like to reconsider the layout of the interactive maps, and organize them in a way that allows the user to view all of them at once.
Thank You.
References
California Zip Code Shapefile: "ca_california_zip_codes_geo.min.json", Open Data Delaware. https://github.com/OpenDataDE/State-zip-code-GeoJSON.
California Air Pollution, Asthma, and Cardiovascular Data: "CalEnviroScreen 3.0 Data", California Office of Environmental Health Hazard Assessment.https://oehha.ca.gov/calenviroscreen/maps-data.
California Deaths by Stroke and Heart Disease: "Leading Causes of Death by Zip Code 1999 - Current", California Health & Human Services Agency.https://data.chhs.ca.gov/dataset/leading-causes-of-death-by-zip-code.
[1] "Rise for Climate", Rise for Climate Action.https://riseforclimate.org/.
[2] "Research", Michael Mendez.http://www.michaelanthonymendez.com/research.html.
[3] Rebecca Hersher. "EPA Science Panel Considering Guidelines That Upend Basic Air Pollution Science", National Public Radio.https://www.npr.org/2019/03/28/707166015/epa-science-panel-considering-guidelines-that-upend-basic-air-pollution-science.
[4] "The Links Between Air Pollution and Childhood Asthma", United States Environmental Protection Agency.https://www.epa.gov/sciencematters/links-between-air-pollution-and-childhood-asthma.
[5] "Ambient air pollution: Health impacts", World Health Organization.https://www.who.int/airpollution/ambient/health-impacts/en/.
